NT Crime Data Dashboard
Overview
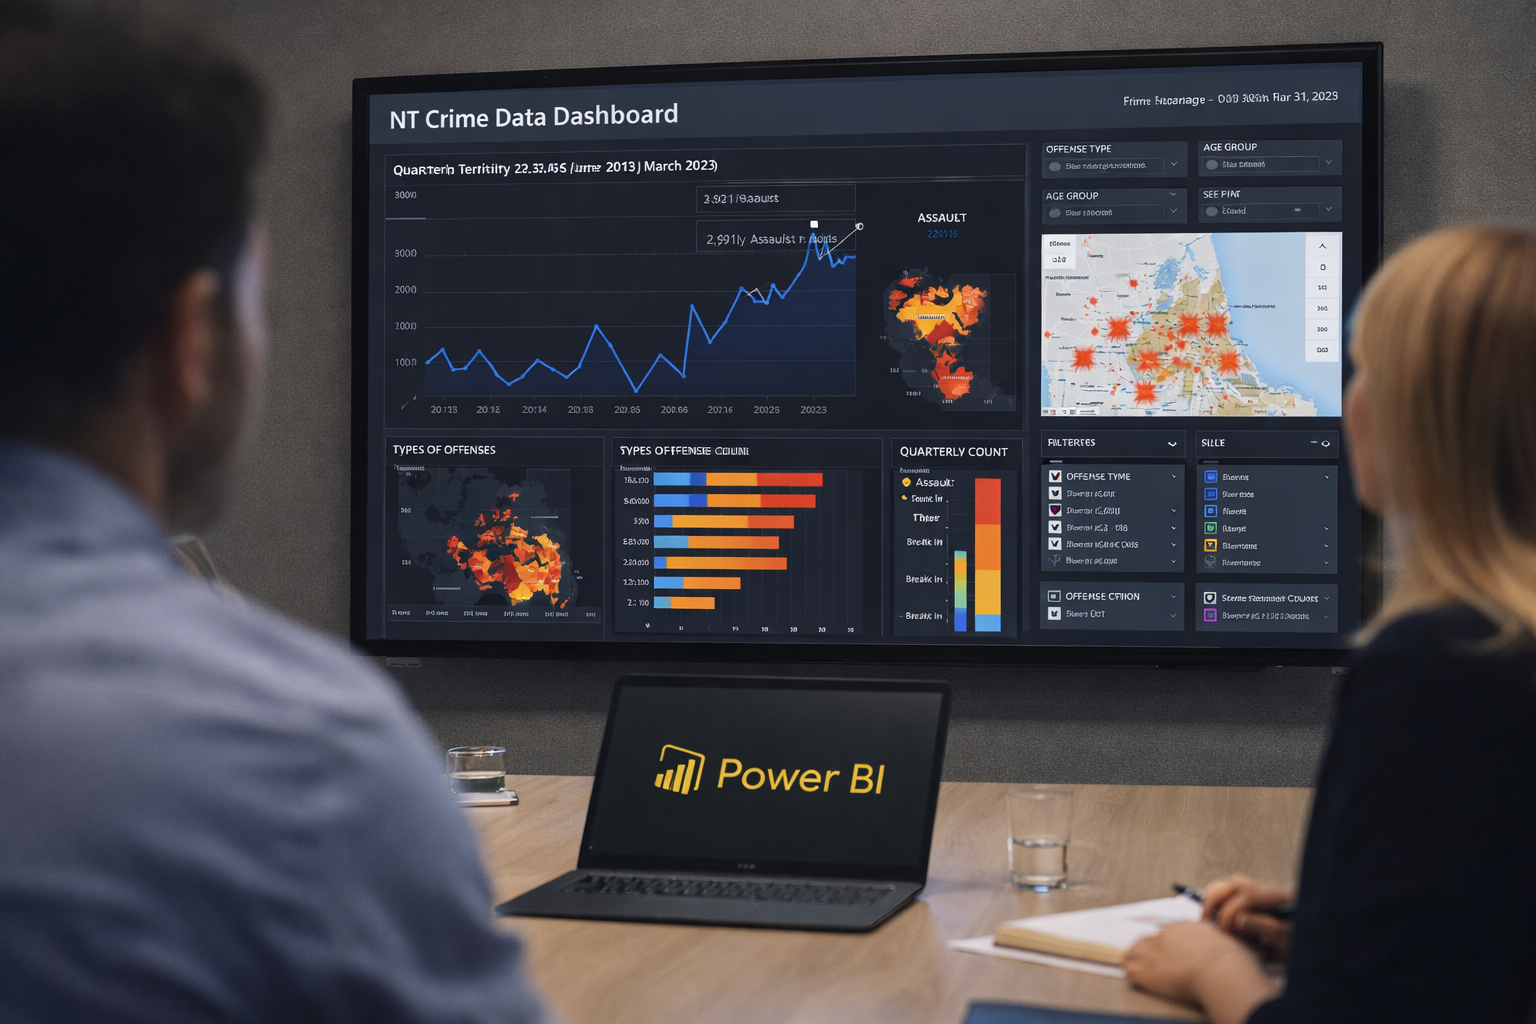
Built an interactive Power BI dashboard to explore crime data across the Northern Territory. The objective was to transform raw offence records into a clear, visual report that allows users to identify trends over time, compare offence categories, and understand geographic patterns at a glance.
Analysis & Approach
- Prepared and cleaned the dataset to ensure consistent offence categories, dates, and locations.
- Designed a simple data model with clear relationships to support flexible reporting.
- Created time-series visuals to analyse changes in crime volume across months and years.
- Built offence category breakdowns to compare property, violent, and public-order related incidents.
- Used map-based visuals to highlight geographic concentration and potential hotspots.
- Focused on usability: clear KPIs, intuitive slicers, and a layout suitable for non-technical users.
Outcome
This dashboard demonstrates my ability to take a real-world public dataset and turn it into a structured, insight-driven report. While the project focuses on crime data, the same analytical approach can be applied to business, operational, or service performance data.